ChartJS | How to draw Bar chart from server data using MySQL, Ajax and PHP
Last updated 6 years, 6 months ago | 11772 views 75 5
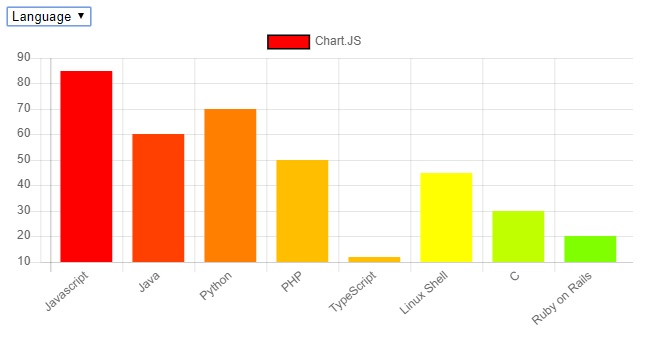
Chart.JS | Draw Bar chart from server data using MySQL, Ajax, and PHP
This example shows how to draw a bar chart with data from the database server.
FILE STRUCTURE
At the end of this example, we will have the following folders and files.
├─── graph_ajax_demo/
├────── index.php - file that will draw graph based on database records.
├────── get_data.php - contains properties for Ajax request.
SETUP THE DATABASE
Using PhpMyAdmin, create a new "test" database. After that, run the following SQL queries to create new tables with sample data.
Table structure for table `chart`
CREATE TABLE `chart` (
  `id` int(11) NOT NULL AUTO_INCREMENT,
  `data` varchar(100) NOT NULL,
  `value` int(11) NOT NULL,
  `type` int(11) NOT NULL
) ENGINE=InnoDB DEFAULT CHARSET=latin1;
Dumping data for table `chart`
INSERT INTO `chart` (`id`, `data`, `value`, `type`) VALUES
(1, 'Javascript', 85, 1),
(2, 'Java', 60, 1),
(3, 'Python', 70, 1),
(4, 'PHP', 50, 1),
(6, 'TypeScript', 12, 1),
(7, 'Linux Shell', 45, 1),
(8, 'C', 30, 1),
(9, 'Ruby on Rails', 20, 1),
(10, 'VSCode', 70, 2),
(11, 'Eclipse', 50, 2),
(12, 'Notepad++', 18, 2),
(13, 'Atom', 35, 2),
(14, 'NetBeans', 45, 2),
(15, 'Zend Studio', 30, 2),
(16, 'PyCharm', 40, 2);
Create a folder "graph_ajax_demo". Create "index.php" file inside the "graph_ajax_demo" folder and place the following code inside it
The code is used to select all records from the server where type = 1. This data is used to draw charts with page load.
PHP code
<?php
	// DB connection
	$conn = new mysqli("localhost", "root", "", "test");

	// Assign variables
	$labels = $datas = "";

	// Select query to fetch data with page load
	$sql = "select data, value from chart where type = 1";
	$result = $conn->query($sql);

	// Create data in comma separated string
	while($row = $result->fetch_assoc()){
		$labels .= "'" . $row['data'] . "',";
		$datas .= $row['value'] . ",";
	}

	// Remove the last comma from the string
	$lbl = trim($labels, ",");
	$val = trim($datas, ",");

?>
HTML code
This is a basic HTML code with a dropdown and canvas element. Here dropdown is used to make an Ajax request to change the bar chart on the basis of Language and IDE and the chart is drawn on the canvas element. Place the following code inside the "index.php" file after the "PHP" end tag.
<!DOCTYPE html>
<html lang="en">
  <head>
    <meta charset="utf-8">
    <meta name="viewport" content="width=device-width, initial-scale=1, shrink-to-fit=no">
    <title>Bar Chart</title>
	<script src="https://ajax.googleapis.com/ajax/libs/jquery/1.12.4/jquery.min.js"></script>
	<script src="https://cdnjs.cloudflare.com/ajax/libs/Chart.js/2.4.0/Chart.min.js"></script>
  </head>
	<body>

		<select name="option" id="option">
			<option value="1">Language</option>
			<option value="2">IDE</option>
		</select>

        <div class="chart-container" style="position: relative; width:80vw">
            <canvas id="my_Chart"></canvas>
        </div>


	</body>
</html>
Javascript code
This is the javascript code that is used to draw the chart with page load. Place the following code inside the "index.php" file in the body element.
<script>

    var lbl = [<?= $lbl ?>]; // Get Labels from php variable
    var val = [<?= $val ?>]; // Get Data from php variable

    // Chart data with page load
    myData = {
        labels: lbl,
        datasets: [{
            label: "Chart.JS",
            fill: false,
            backgroundColor: ['#ff0000', '#ff4000', '#ff8000', '#ffbf00', '#ffbf00', '#ffff00', '#bfff00', '#80ff00'],
            borderColor: 'black',
            data: val,
        }]
    };

    // Draw default chart with page load
    var ctx = document.getElementById('my_Chart').getContext('2d');
    var myChart = new Chart(ctx, {
        type: 'bar',    // Define chart type
        data: myData    // Chart data
    });

</script>
Ajax code
This is another javascript code that allows us to fetch data from the server without page load. It works with dropdown selection. Each time when dropdown value change this peace of code make an Ajax request and fetch data from the server. The "myChart.destroy()" destroy the Previously created chart and then a new chart is drawn with new data in the save canvas element.
Place the following code inside the "index.php" file in the body element.
<script>
// Draw chart with Ajax request
    $('#option').on('change', function (e) {
        var type = this.value;
        $.ajax({
            url: 'http://localhost/chart_ajax_php/get_data.php',
            dataType: 'json',
            data: {'id':type},
            success: function(e){

                // Delete previous chart
                myChart.destroy();

                //Draw new chart with ajax data
                myChart = new Chart(ctx, {
                    type: 'bar',    // Define chart type
                    data: e    		// Chart data
                });
            }
        });
    });
</script>
get_data.php file
The above Ajax code will not work without the "get_data.php" file. To create a new file inside the "graph_ajax_demo" folder. Now place the following code inside it.
<?php
	// DB connection
	$conn = new mysqli("localhost", "root", "", "test");

	// Check the GET request
	if(isset($_GET['id']) && $_GET['id'] != '')
	{
		// Select query on GET request
		$sql = "select data, value from chart where type =".$_GET['id'];
		$result = $conn->query($sql);

		// Store data in array
		while($row = $result->fetch_assoc()){
			$labels[] = $row['data'];
			$datas[] = $row['value'];
		}

		// Chart data for ajax request
		$data = array(
			'labels' => $labels,
			'datasets' => array(array(
				'label' => "Chart.JS",
				'fill' => false,
				'backgroundColor' => array('#ff0000', '#ff4000', '#ff8000', '#ffbf00', '#ffbf00', '#ffff00', '#bfff00', '#80ff00'),
				'borderColor' => 'black',
				'data' => $datas,

			)),
		);

		// Convert and echo data in JSON format
		echo json_encode($data);
	}

?>
index.php file
The final code for the "index.php" file
<?php
	// DB connection
	$conn = new mysqli("localhost", "root", "", "test");

	// Assign variables
	$labels = $datas = "";

	// Select query to fetch data with page load
	$sql = "select data, value from chart where type = 1";
	$result = $conn->query($sql);

	// Create data in comma seperated string
	while($row = $result->fetch_assoc()){
		$labels .= "'" . $row['data'] . "',";
		$datas .= $row['value'] . ",";
	}

	// Remove the last comma from the string
	$lbl = trim($labels, ",");
	$val = trim($datas, ",");

?>

<!DOCTYPE html>
<html lang="en">
  <head>
    <meta charset="utf-8">
    <meta name="viewport" content="width=device-width, initial-scale=1, shrink-to-fit=no">
    <title>Bar Chart</title>
	<script src="https://ajax.googleapis.com/ajax/libs/jquery/1.12.4/jquery.min.js"></script>
	<script src="https://cdnjs.cloudflare.com/ajax/libs/Chart.js/2.4.0/Chart.min.js"></script>
  </head>
	<body>

		<select name="option" id="option">
			<option value="1">Language</option>
			<option value="2">IDE</option>
		</select>

        <div class="chart-container" style="position: relative; width:80vw">
            <canvas id="my_Chart"></canvas>
        </div>

		<script>

			var lbl = [<?= $lbl ?>]; // Get Labels from php variable
			var val = [<?= $val ?>]; // Get Data from php variable

			// Chart data with page load
			myData = {
				labels: lbl,
				datasets: [{
					label: "Chart.JS",
					fill: false,
					backgroundColor: ['#ff0000', '#ff4000', '#ff8000', '#ffbf00', '#ffbf00', '#ffff00', '#bfff00', '#80ff00'],
					borderColor: 'black',
					data: val,
				}]
			};

			// Draw default chart with page load
			var ctx = document.getElementById('my_Chart').getContext('2d');
			var myChart = new Chart(ctx, {
				type: 'bar',    // Define chart type
				data: myData    // Chart data
			});


			// Draw chart with Ajax request
			$('#option').on('change', function (e) {
				var type = this.value;
				$.ajax({
					url: 'http://localhost/chart_ajax_php/get_data.php',
					dataType: 'json',
					data: {'id':type},
					success: function(e){

						// Delete previous chart
						myChart.destroy();

						//Draw new chart with Ajax data
						myChart = new Chart(ctx, {
							type: 'bar',    // Define chart type
							data: e    		// Chart data
						});
					}
				});
			});

		</script>

	</body>
</html>