ChartJS change graph type based on Dropdown selection
Last updated 6 years, 5 months ago | 10552 views 75 5
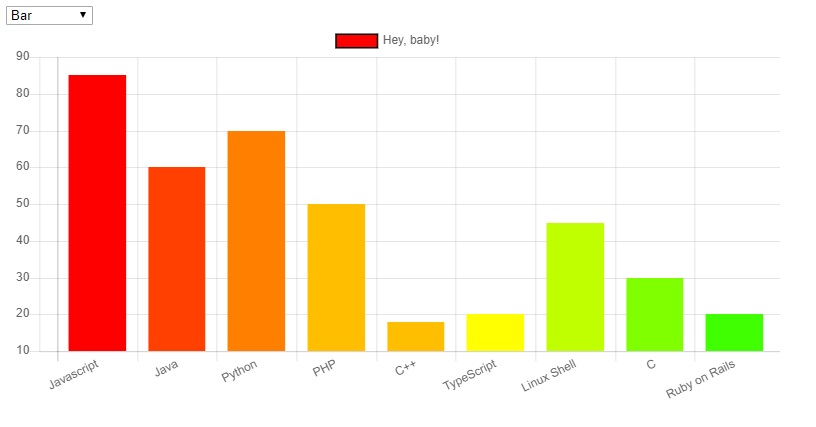
Chart.js | Changing graph type based on dropdown selection
We can’t directly update the chart type in Chart.js, to achieve the requirement we need to destroy the original chart and then redraw the new chart.
In this example, we can draw five types of charts from chart.js to destroy the previous one and draw a new one with the same data.
Here is the list of chart types which we are going to use in this example.
- Bar
- Line
- Pie
- Radar
- Polar Area
Let’s see how we can destroy the original chart and then redraw the new chart
Step 1: Create a basic HTML file called "chart.html"
<!DOCTYPE html>
<html lang="en">
  <head>
    <meta charset="utf-8">
    <meta name="viewport" content="width=device-width, initial-scale=1, shrink-to-fit=no">
    <title>Bar Chart</title>
  </head>
	<body>

	</body>
</html>
Step 2: Add a "Chart.min.js" CDN link inside the "head" tag.
<head>
    <meta charset="utf-8">
    <meta name="viewport" content="width=device-width, initial-scale=1, shrink-to-fit=no">
    <title>Bar Chart</title>
    <script src="https://cdnjs.cloudflare.com/ajax/libs/Chart.js/2.4.0/Chart.min.js"></script>
</head>
If you don't want to use the CDN server then you can download the "chart.js" JavaScript plugin from http://www.chartjs.org/
Step 3: Now add a canvas element in the body element.
<body>
	<select name="chartType" id="chartType" onchange="updateChartType()">
		<option value="bar">Bar</option>
		<option value="line">Line</option>
		<option value="pie">Pie</option>
		<option value="radar">Radar</option>
		<option value="polarArea">Polar Area</option>
	</select>
    <div class="chart-container" style="position: relative; width:80vw">
        <canvas id="my_Chart"></canvas>
    </div>
</body>
We are going to change the chart type on the basis of the value selected in the dropdown. This work on javascript "onchange" event. With this dropdown, we are able to draw five types of the chart from chart.js
You can add any number of chart types from chart.js in the dropdown if required.
Step 4: Now add some javascript to bind the canvas element and dropdown to chart on basis of dropdown
<body>
    <div class="chart-container" style="position: relative; width:80vw">
        <canvas id="my_Chart"></canvas>
    </div>

    <script>

        // Data define for bar chart

			var myData = {
				labels: ["Javascript", "Java", "Python", "PHP", "C++", "TypeScript", "Linux Shell","C","Ruby on Rails"],
				datasets: [{
					label: "Hey, baby!",
					fill: false,
					backgroundColor: ['#ff0000', '#ff4000', '#ff8000', '#ffbf00', '#ffbf00', '#ffff00', '#bfff00', '#80ff00', '#40ff00', '#00ff00'],
					borderColor: 'black',
					data: [85, 60,70, 50, 18, 20, 45, 30, 20],
				}]
			};

			// Code to drow Chart
            // Default chart defined with type: 'bar'

			var ctx = document.getElementById('my_Chart').getContext('2d');
			var myChart = new Chart(ctx, {
				type: 'bar',    	// Define chart type
				data: myData    	// Chart data
			});

			// Function runs on chart type select update

			function updateChartType() {
                // Destroy the previous chart

				myChart.destroy();

                // Draw a new chart on the basic of dropdown

				myChart = new Chart(ctx, {
					type: document.getElementById("chartType").value,  // Select chart type from dropdown
					data: myData
				});
			};
    </script>
</body>
The final code is here.
<!DOCTYPE html>
<html lang="en">
  <head>
    <meta charset="utf-8">
    <meta name="viewport" content="width=device-width, initial-scale=1, shrink-to-fit=no">
    <title>Bar Chart</title>
	<script src="https://cdnjs.cloudflare.com/ajax/libs/Chart.js/2.4.0/Chart.min.js"></script>
  </head>
	<body>

	    // Drop down to change chart type

		<select name="chartType" id="chartType" onchange="updateChartType()">
			<option value="bar">Bar</option>
			<option value="line">Line</option>
			<option value="pie">Pie</option>
			<option value="radar">Radar</option>
			<option value="polarArea">Polar Area</option>
		</select>

       // canvas element

        <div class="chart-container" style="position: relative; width:80vw">
            <canvas id="my_Chart"></canvas>
        </div>


		<script>

			// Data define for bar chart

			var myData = {
				labels: ["Javascript", "Java", "Python", "PHP", "C++", "TypeScript", "Linux Shell","C","Ruby on Rails"],
				datasets: [{
					label: "Hey, baby!",
					fill: false,
					backgroundColor: ['#ff0000', '#ff4000', '#ff8000', '#ffbf00', '#ffbf00', '#ffff00', '#bfff00', '#80ff00', '#40ff00', '#00ff00'],
					borderColor: 'black',
					data: [85, 60,70, 50, 18, 20, 45, 30, 20],
				}]
			};

			// Code to drow Chart
            // Default chart defined with type: 'bar'

			var ctx = document.getElementById('my_Chart').getContext('2d');
			var myChart = new Chart(ctx, {
				type: 'bar',    	// Define chart type
				data: myData    	// Chart data
			});

			// Function runs on chart type select update

			function updateChartType() {
                // Destroy the previous chart

				myChart.destroy();

                // Draw a new chart on the basic of dropdown

				myChart = new Chart(ctx, {
					type: document.getElementById("chartType").value,  // Select chart type from dropdown
					data: myData
				});
			};

		</script>
	</body>
</html>
