Chart.js | Add bar chart in the webpage
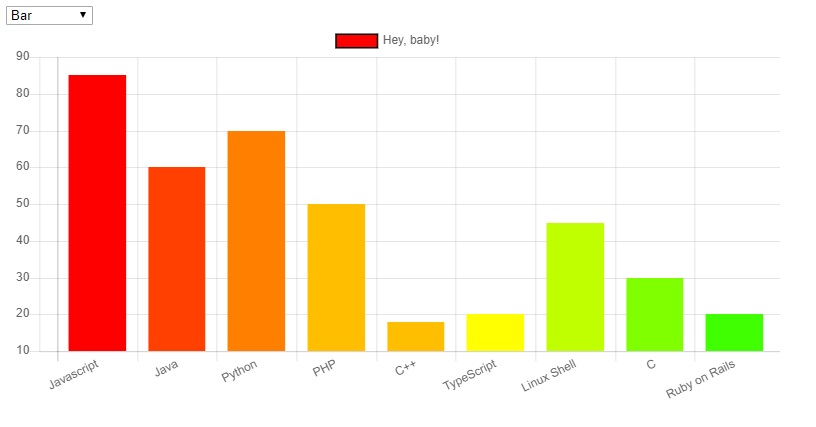
This is a simple example of using Chart.js to create a bar chart on the webpage.
Step 1: Create a basic HTML file called "chart.html"
<!DOCTYPE html>
<html lang="en">
  <head>
    <meta charset="utf-8">
    <meta name="viewport" content="width=device-width, initial-scale=1, shrink-to-fit=no">
    <title>Bar Chart</title>
  </head>
	<body>

	</body>
</html>
Step 2: Add a "Chart.min.js" CDN link inside the "head" tag
<head>
    <meta charset="utf-8">
    <meta name="viewport" content="width=device-width, initial-scale=1, shrink-to-fit=no">
    <title>Bar Chart</title>
    <script src="https://cdnjs.cloudflare.com/ajax/libs/Chart.js/2.4.0/Chart.min.js"></script>
</head>
If you don't want to use the CDN server then you can download the "chart.js" JavaScript plugin from www.chartjs.org
Step 3: Now add a canvas element in the body element.
<body>
    <div class="chart-container" style="position: relative; width:80vw">
        <canvas id="my_Chart"></canvas>
    </div>
</body>
Here div element is used to manage chart area like position, width, etc.
Step 4: Then add some javascript to bind the canvas element to the drow bar chart.
<body>
    <div class="chart-container" style="position: relative; width:80vw">
        <canvas id="my_Chart"></canvas>
    </div>

    <script>

        // data define for bar chart

        var myData = {
            labels: ["Javascript", "Java", "Python", "PHP", "C++", "TypeScript", "Linux Shell","C","Ruby on Rails"],
            datasets: [{
                label: "Hey, baby!",
                fill: false,
                backgroundColor: ['#ff0000', '#ff4000', '#ff8000', '#ffbf00', '#ffbf00', '#ffff00', '#bfff00', '#80ff00', '#40ff00', '#00ff00'],
                borderColor: 'black',
                data: [85, 60,70, 50, 18, 20, 45, 30, 20],
            }]
        };


        //Code to drow Chart

        var ctx = document.getElementById('my_Chart').getContext('2d');
        var myChart = new Chart(ctx, {
            type: 'bar',    // Define chart type
            data: myData    // Chart data
        });
    </script>
</body>
The complete code is here. You can simply copy and paste the below code to draw a bar chart on your page.
<!DOCTYPE html>
<html lang="en">
  <head>
    <meta charset="utf-8">
    <meta name="viewport" content="width=device-width, initial-scale=1, shrink-to-fit=no">
    <title>Bar Chart</title>
	<script src="https://cdnjs.cloudflare.com/ajax/libs/Chart.js/2.4.0/Chart.min.js"></script>
  </head>
	<body>

        <div class="chart-container" style="position: relative; width:80vw">
            <canvas id="my_Chart"></canvas>
        </div>


		<script>

			// data define for bar chart

			var myData = {
				labels: ["Javascript", "Java", "Python", "PHP", "C++", "TypeScript", "Linux Shell","C","Ruby on Rails"],
				datasets: [{
					label: "Hey, baby!",
					fill: false,
					backgroundColor: ['#ff0000', '#ff4000', '#ff8000', '#ffbf00', '#ffbf00', '#ffff00', '#bfff00', '#80ff00', '#40ff00', '#00ff00'],
					borderColor: 'black',
					data: [85, 60,70, 50, 18, 20, 45, 30, 20],
				}]
			};


			//Code to drow Chart

			var ctx = document.getElementById('my_Chart').getContext('2d');
			var myChart = new Chart(ctx, {
				type: 'bar',    // Define chart type
				data: myData    // Chart data
			});

		</script>
	</body>
</html>